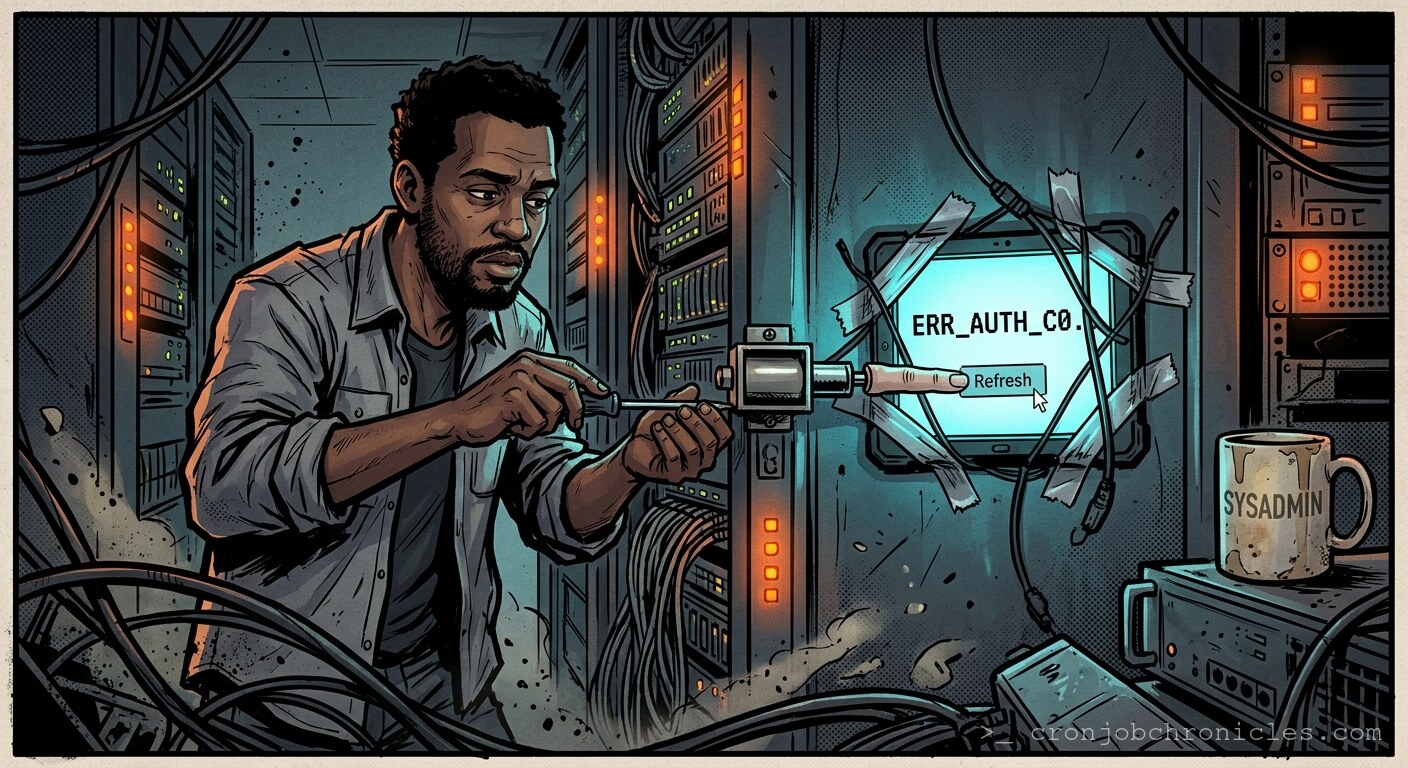
Listen, anyone who tells you their monitoring stack is “100% reliable” is either selling you something or hasn’t been in the game long enough to see a cascading failure turn a data center into an expensive, silent brick.
We spend our careers building elaborate Rube Goldberg machines of observability. We use Prometheus to scrape exporters that check if the node-exporter is exporting, and we send alerts to PagerDuty via an API that is—inevitably—hosted on the very infrastructure we’re trying to monitor. It’s the sysadmin version of the Ouroboros, eating its own tail until the monitoring system itself becomes the bottleneck, the alert source, and, quite often, the primary cause of downtime.
I’ve sat in rooms where a flapping network interface triggered a retry storm so aggressive that our internal Grafana instance consumed all available IOPS, crashing the database, which in turn triggered a global alert, which sent ten thousand SMS notifications, which, due to a misconfigured webhook, sent a POST request back to the load balancer that was already dying under the weight of the initial retry storm. It was beautiful. It was a perfect, self-inflicted execution.
The Recursive Trap
The core assumption is that we are “observing” the system from the outside. But we aren’t. We are part of the system. Every agent we install, every sidecar we inject, every synthetic probe we launch—it all consumes CPU, memory, and—most dangerously—entropy. At what point does the observer effect invalidate the data? When we monitor the monitor, we aren’t creating stability; we’re creating a feedback loop. Sometimes, I wonder if the “monitoring” is just a pacifier for our own anxiety, a way to convince ourselves that if we just have enough dashboards, the entropy of the universe won’t catch up to our production environment.
Prerequisites for Meta-Monitoring
- A baseline of “normal” that isn’t just an arbitrary number pulled from a junior dev’s dreams.
- Out-of-band management access (I’m talking physical serial consoles, not just another SSH session over the public net).
- A deep, existential acceptance that your alerts will eventually lie to you.
The “Health Check” Paradox
I once had to manage a cluster where the “health checker” was so poorly written that it would time out if the system load exceeded 4.0. The system load only exceeded 4.0 because the health checker was running a heavy, unoptimized shell script to determine if the system was healthy. We spent three weeks “optimizing” the health checker when, in reality, we were just chasing our own tails in a digital hall of mirrors. Is the system slow, or are we just making it slow by asking it how it feels every five seconds?
If you find yourself spending more time maintaining the monitoring pipeline than the actual application, you haven’t built an observability stack—you’ve built a second, shadow application that happens to be more fragile than the first. It makes one ask: are we monitoring the system, or are we just watching a very complex movie about how the system used to function?
A Necessary Diversion: The Caffeine-to-Uptime Conversion Script
Since we’re obsessed with tracking, let’s track the only variable that actually impacts MTTR (Mean Time To Recovery): the administrator’s caffeine levels. If this script hits zero, the cluster is effectively down, regardless of what the dashboards say.
#!/bin/bash
# Caffeine-to-Uptime Correlation Script
# Usage: ./monitor_human.sh [cups_consumed]

set -euo pipefail

LOG_FILE="/var/log/sysadmin_sanity.log"
MIN_THRESHOLD=3

log_message() {
    echo "[$(date +'%Y-%m-%dT%H:%M:%S')] $1" >> "$LOG_FILE"
}

cups=${1:-0}

if [ "$cups" -lt "$MIN_THRESHOLD" ]; then
    log_message "CRITICAL: Caffeine levels sub-optimal. Admin reaction latency increasing."
    echo "Warning: Get more coffee. The servers can smell your exhaustion."
    exit 1
else
    log_message "INFO: Caffeine levels nominal. System stability maintained."
    echo "Optimal. Proceed with the kernel upgrade."
fi
The Restoration Fallacy
When the monitoring system dies, the first instinct is to “restore it.” But restore it to what? A state of false confidence? If your monitoring fails, don’t just restart the process. Use the silence as a diagnostic tool. How does the system behave when you aren’t watching? Does it get faster? Does the CPU usage drop? Sometimes, the most honest monitoring tool is the one that shuts up and lets the machine run its course.
How to restore? Simple: Delete the cache, flush the buffers, and restart the collector service—but for heaven’s sake, don’t restart the entire stack at once unless you want a thundering herd problem that will make your metrics look like a mountain range of noise. Bring it up node by node. Observe the observers.
There is something inherently absurd about the layers we build. We stack software on top of hardware on top of abstraction on top of abstraction, and then we build a monitoring stack on top of that to tell us why the abstraction is leaking. It’s turtles all the way down, and the turtles are all running high CPU.
Wait, I just got an alert from the out-of-band management interface. It’s claiming the core switch is overheating, but the telemetry from the PDUs says the rack is ice cold. It’s either a ghost in the machine or the monitoring system has finally gained sentience and decided to gaslight me. Now, if you’ll excuse me, I have a rack to go physically inspect because my tools are currently engaged in a deep philosophical dispute with reality.